Welcome! This document will guide you through formatting in Quarto.
Key Topics
- Economic Variables
- Economic Calculations
- Market Equilibrium
- Utility Maximization
- Plot in R
Economic Variables
Here’s a simple data set of economic indicators:
| GDP |
21.4 |
trillion USD |
| Inflation |
2.1 |
percent |
| Interest Rate |
4.5 |
percent |
| Unemployment |
3.8 |
percent |
Economic Calculations
Let’s examine some economic relationships. The demand function for a product is:
\[
Q_d = 1000 - 2P + 0.5Y
\]
where \(Q_d\) is quantity demanded, \(P\) is price, and \(Y\) is income.
The partial derivative with respect to price shows price sensitivity:
\[
\frac{\partial Q_d}{\partial P} = -2
\]
Market Equilibrium
For a market with linear supply and demand curves:
\[\begin{align}
Q_d &= 100 - 2P \\
Q_s &= -20 + 3P \\
Q_d &= Q_s
\end{align}\]
Utility Maximization
Consider a consumer’s utility function: \[\begin{align}
U(x,y) &= \ln(x) + \beta y \\
\text{s.t. } P_x x + P_y y &= M
\end{align}\]
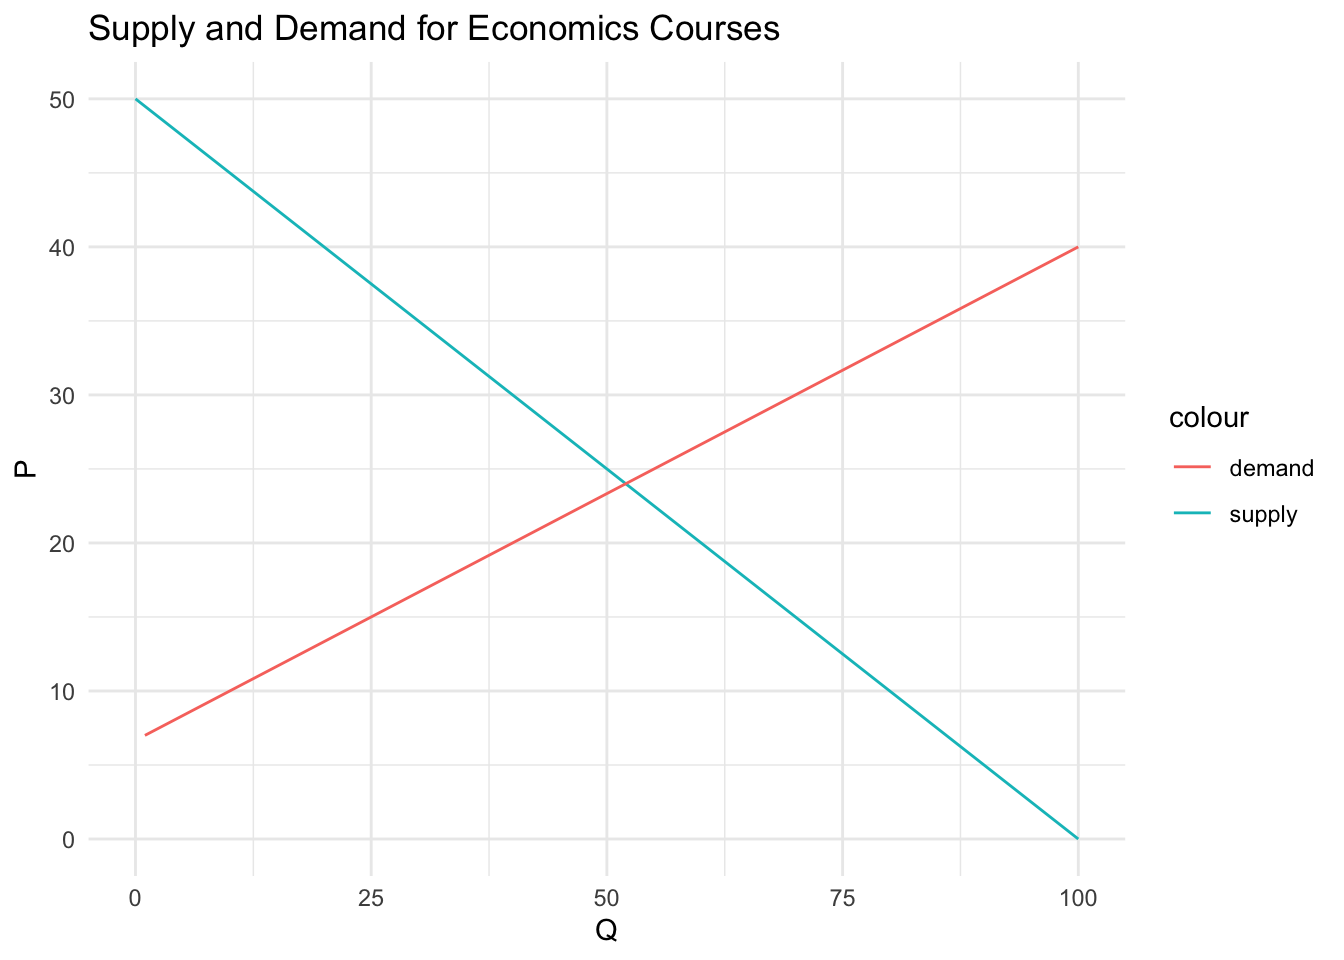
Plot in R
── Attaching core tidyverse packages ──────────────────────── tidyverse 2.0.0 ──
✔ dplyr     1.1.4     ✔ readr     2.1.5
✔ forcats   1.0.0     ✔ stringr   1.5.1
✔ ggplot2   3.5.0     ✔ tibble    3.2.1
✔ lubridate 1.9.3     ✔ tidyr     1.3.1
✔ purrr     1.0.2
── Conflicts ────────────────────────────────────────── tidyverse_conflicts() ──
✖ dplyr::filter() masks stats::filter()
✖ dplyr::lag()    masks stats::lag()
ℹ Use the conflicted package (<http://conflicted.r-lib.org/>) to force all conflicts to become errors
theme_set(theme_minimal())

ggplot() +
  stat_function(fun = function(P) 100 - 2 * P, aes(color = "supply")) +
  stat_function(fun = function(P) -20 + 3 * P, aes(color = "demand")) +
  xlim(0, 50) +
  ylim(0, 100) +
  labs(title = "Supply and Demand for Economics Courses") +
  xlab("P") +
  ylab("Q") +
  coord_flip()
Warning: Removed 34 rows containing missing values or values outside the scale range
(`geom_function()`).