library(tidyverse)
fish <- read_csv("https://raw.githubusercontent.com/cobriant/teaching-datasets/refs/heads/main/fish.csv")4.4 Graddy (2006)
Estimating the Price Elasticity of Demand (The Fulton Fish Market)
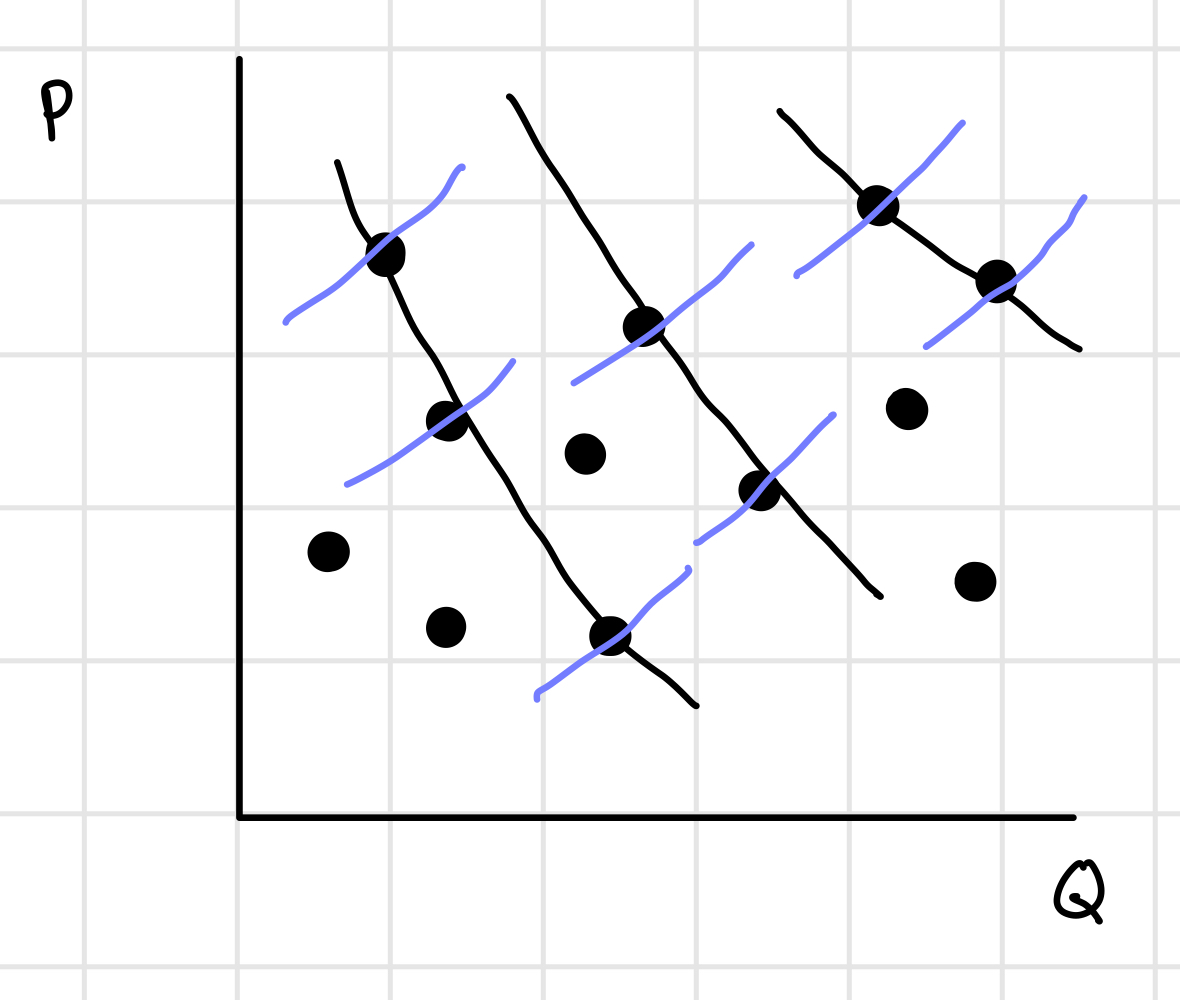
If you have data on prices and quantities sold, does a line of best fit represent demand or supply? The answer is neither, because each (quantity, price) point is determined by the interaction of both supply and demand curves in equilibrium.

However, if you have a shifter—like a variable that affects supply but not demand—you can use these shifts, along with the equilibrium (quantity, price) points, to trace out the demand curve and estimate the price elasticity of demand. This is the skill we’ll practice in this assignment.
Part 1: Understanding the Data
The Fulton Fish Market, one of the largest fish markets in the world, operates in New York City and has a long history dating back to the early 1800s. It serves as a centralized hub where buyers and sellers trade a wide variety of fish, from fresh catches to older stock. The market’s structure helps match buyers with the specific types and qualities of fish they need, making it efficient despite the highly perishable and unpredictable nature of fish supply.
A key factor influencing the market is weather conditions. Wind and waves affect how much fish fishermen can catch. On stormy days, fewer fish are brought to market, leading to higher prices. On calm days, more fish are available, and prices drop. This relationship between weather, supply, and price highlights how sensitive the fish market is to natural conditions.
Another interesting aspect is the difference in how asian buyers and white buyers interact with the market. Asian buyers, who often resell fish in low-income neighborhoods or use it for products like fishballs, tend to have more elastic demand, meaning they are very sensitive to price changes and will bargain hard to get lower prices. In contrast, many white buyers, such as high-end restaurants or suburban retailers, have less elastic demand and can pass higher costs on to their customers. As a result, sellers often charge Asian buyers lower prices than white buyers for the same fish.
- Use ggplot and lm to show that asian buyers get lower fish prices than white buyers.
Answer:
- Interpret your regression from part A: Holding constant the day of the week, the wind speed, the wave height, and the day, white buyers pay on average ___ cents per pound more for fish compared to asian buyers.
Answer:
- Use ggplot and lm to verify that wind speed and wave height predict lower quantities of fish sold at the fish market. Are the effects statistically significant (is the p-value less than .05)?
Answer:
- Interpret the regressions you ran in part c:
- When wind speed increases by 1 unit (holding constant the day of the week, the buyer race, and the day), we estimate that there will be ___ fewer fish sold at the market. The effect (is/is not) significant at the 5% level.
- When wave height increases by 1 unit (holding constant the day of the week, the buyer race, and the day), we estimate that there will be ___ fewer fish sold at the market. The effect (is/is not) significant at the 5% level.
Answer:
Part 2: Estimating the Price Elasticity of Demand
Estimate the price elasticity of demand for asian buyers and then white buyers.
Do this by first running this line of code:
install.packages("ivreg")Now you can use the function ivreg to run an instrumental variables regression: the shifters wind_speed and wave_height are instruments for price: they show the effect of the shifting supply curve, tracing out the demand curve. The coefficient on log(price) is interpreted as the percent increase in the Y variable for a one percent increase in the X variable. That is, the coefficient on log(price) is the elasticity. An elasticity of -1 means that when price increases by 1%, quantity demanded decreases by 1%. An elasticity of -2 means that when price increases by 1%, quantity demanded decreases by 2%: the consumers are elastic. An elasticity of -0.5 means that when price increases by 1%, quantity demanded decreases by 0.5%: consumers are inelastic.
library(ivreg)

fish %>%
  filter(buyer_race == "white") %>%
  ivreg(log(quantity_sold) ~ log(price) + day + mon + tues + wed + thurs | wave_height + wind_speed + day + mon + tues + wed + thurs, data = .) %>%
  broom::tidy()
# A tibble: 7 × 5
term estimate std.error statistic p.value
<chr> <dbl> <dbl> <dbl> <dbl>
1 (Intercept) 7.05 0.237 29.7 2.83e-48
2 log(price) -0.817 0.479 -1.71 9.16e- 2
3 day -0.00112 0.00345 -0.324 7.47e- 1
4 mon 0.121 0.266 0.454 6.51e- 1
5 tues -0.695 0.262 -2.66 9.28e- 3
6 wed -0.523 0.261 -2.00 4.83e- 2
7 thurs 0.497 0.262 1.90 6.06e- 2fish %>%
filter(buyer_race == "asian") %>%
ivreg(log(quantity_sold) ~ log(price) + day + mon + tues + wed + thurs | wave_height + wind_speed + day + mon + tues + wed + thurs, data = .) %>%
broom::tidy()# A tibble: 7 × 5
term estimate std.error statistic p.value
<chr> <dbl> <dbl> <dbl> <dbl>
1 (Intercept) 7.84 0.249 31.5 2.03e-50
2 log(price) -0.953 0.481 -1.98 5.05e- 2
3 day -0.00349 0.00369 -0.946 3.47e- 1
4 mon -0.611 0.279 -2.19 3.10e- 2
5 tues -0.817 0.272 -3.00 3.52e- 3
6 wed -0.486 0.269 -1.81 7.36e- 2
7 thurs -0.122 0.270 -0.451 6.53e- 1- Interpret the IV regressions you ran:
- White buyers have a price elasticity of demand of ___. When price increases by 1%, white buyers demand ___% fewer fish.
- Asian buyers have a price elasticity of demand of ___. When price increases by 1%, asian buyers demand ___% fewer fish.
- Perfectly elastic buyers have a price elasticity of infinity: when price increases by 1%, perfectly elastic buyers demand infinity % fewer fish (their demand goes to 0).
- Perfectly inelastic buyers have a price elasticity of 0: when price increases by 1%, perfectly inelastic buyers demand 0% fewer fish (their demand stays exactly the same).
- Asian buyers respond more to price increases than white buyers: their demand is more (elastic/inelastic). This makes sense because asian buyers resell fish in low-income neighborhoods or use it for products like fishballs, so are very sensitive to price changes. But white buyers are more likely to sell to high-end restaurants or suburban retailers, so they have less elastic demand because they can pass higher costs on to their customers.
Answer: