4.1 Invisible Hand
In this assignment, I’ll introduce the idea of the supply curve, and then I’ll show how the intersection of the supply and demand curves dictate the equilibrium market price and quantity exchanged. We’ll go much more into depth about the supply curve in unit 5: producer theory.
The Supply Curve
Just like the demand curve represented how much of a certain good consumers are willing to purchase at any given price, the supply curve represents how much of a certain good sellers are willing to sell at any given price.
We learned that demand curves are downward sloping because of economic incentives: stores can drop prices to incentivize people to rush in and buy up their inventory.
Supply curves, on the other hand, are upward sloping, also due to economic incentives. Imagine I have a box of girl scout cookies, and you want some. If you offer me 25 cents per cookie, I might be willing to let you buy a few from me. But if you offer me $10 per cookie, I’m happy to sell you the whole box! As prices increase, sellers generally become more and more willing to sell higher quantities of their goods or services because it becomes increasingly profitable for them to do so.
Consider the supply curve \(p = \frac{1}{2} q + 1\), where \(p\) refers to the price of the good and \(q\) refers to the quantity supplied.
- Draw this supply curve using ggplot and stat_function.
- How high does the price need to go for sellers to be willing to sell the first tiny fraction of a unit (y-intercept)?
- How many units of the good are sellers willing to sell at prices $1, $2, and $3?
Answer:
Shifts in the Supply Curve
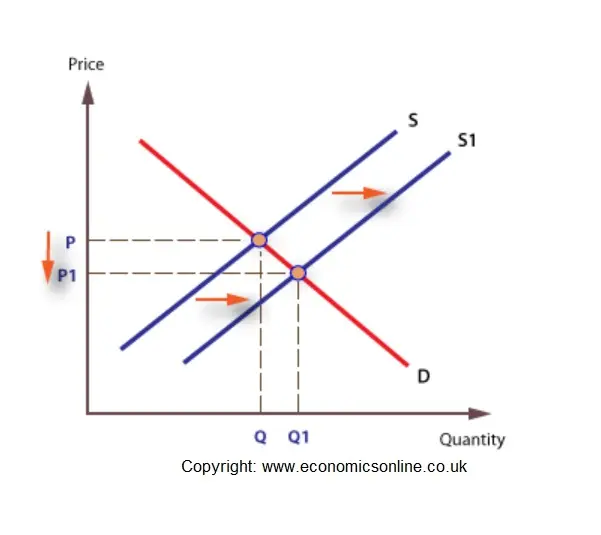
Just like demand curves, supply curves are constantly shifting around. If sellers become willing to supply more units at any given price, that’s an increase in supply (the supply curve shifts to the right or down).
If sellers are no longer willing to supply as much at any given price, that’s a decrease in supply (the supply curve shifts to the left or up).
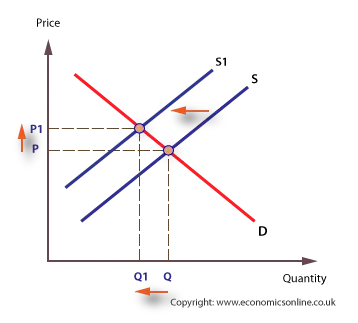
The main factor that shifts supply curves around are increases or decreases in production costs. If the costs of producing something increases, the supply curve for that good shifts to the left. If the costs of producing something decreases, the supply curve for that good shifts to the right.
For each of these scenarios, make a prediction about whether the supply curve for the good will shift to the right or to the left.
If the price of steel increased significantly, what would happen to the supply curve for cars?
If a new technology reduced the cost of producing solar panels, what would happen to the supply curve for solar panels?
If wages for factory workers increased significantly, what would happen to the supply curve for manufactured goods?
If the government subsidized the production of electric vehicles (EVs), what would happen to the supply curve for EVs?
If a drought increased the cost of irrigation for farmers, what would happen to the supply curve for agricultural products like wheat?
Answer:
Equilibrium
Consider the supply curve \(p = \frac{1}{200} q_s + 1\) and the demand curve \(p = \frac{-1}{100} q_d + 4\).
- Use ggplot and stat_function to draw both curves on one plot.
- Suppose the market price for the good is $3. Find the quantity demanded and the quantity supplied at that price. Is there a shortage, a surplus, or neither? If there is a shortage or a surplus, identify whether there will be upward or downward pressure on the market price, and explain why.
- Suppose the market price for the good is $1. Find the quantity demanded and the quantity supplied at that price. Is there a shortage, a surplus, or neither? If there is a shortage or a surplus, identify whether there will be upward or downward pressure on the market price, and explain why.
- Suppose the market price for the good is $2. Find the quantity demanded and the quantity supplied at that price. Is there a shortage, a surplus, or neither? If there is a shortage or a surplus, identify whether there will be upward or downward pressure on the market price, and explain why.
Answer:
The Wealth of Nations
Adam Smith (1723–1790), a Scottish economist and philosopher, introduced the concept of the “invisible hand” in his influential work, The Wealth of Nations (1776). This idea explains how individuals pursuing their self-interest in free markets unintentionally benefit society as a whole. As Smith famously wrote: “It is not from the benevolence of the butcher, the brewer, or the baker, that we expect our dinner, but from their regard to their own interest.”
Smith argued that competition and the price mechanism, guided by supply and demand, naturally allocate resources efficiently without central control.
Smith’s theories were shaped by comparing Britain’s prosperity with Spain’s economic struggles. Britain thrived with its growing industries and trade, fueled by free markets and limited government intervention. Meanwhile, Spain stagnated despite colonial wealth, hampered by government control, monopolies, and restrictive trade policies.
From these observations, Smith concluded that a nation’s wealth stems from its people’s productivity and efficient markets, not from hoarding precious metals. Britain’s success demonstrated how free trade, specialization, and self-interest could create prosperity.