library(tidyverse)
fish <- read_csv("https://raw.githubusercontent.com/cobriant/teaching-datasets/refs/heads/main/fish.csv")Dplyr Review: Fulton Fish Market
To review the dplyr, ggplot2, and lm tools we’ve learned, we’ll complete a data project in this classwork and the next, replicating Kathryn Graddy’s (2006) paper Markets: The Fulton Fish Market. Graddy hand-collected the data by observing the Fulton Fish Market in New York for three months, getting a whiting fish seller to report to her negotiated prices.
A key factor influencing the fish market is weather conditions: wind and waves affect how much fish fishermen can catch. On stormy days, fewer fish are brought to market, leading to higher prices. On calm days, more fish are available, and prices drop.
Another interesting aspect is the difference in how Asian buyers and White buyers interact with the market. Asian buyers, who often resell fish in low-income neighborhoods or use it for products like fishballs, tend to have more elastic demand, meaning they are very sensitive to price changes and will bargain hard to get lower prices. In contrast, White buyers often work for high-end restaurants or suburban retailers, and can pass on higher costs to their customers. As a result, sellers sometimes charge White buyers higher prices for the same fish.
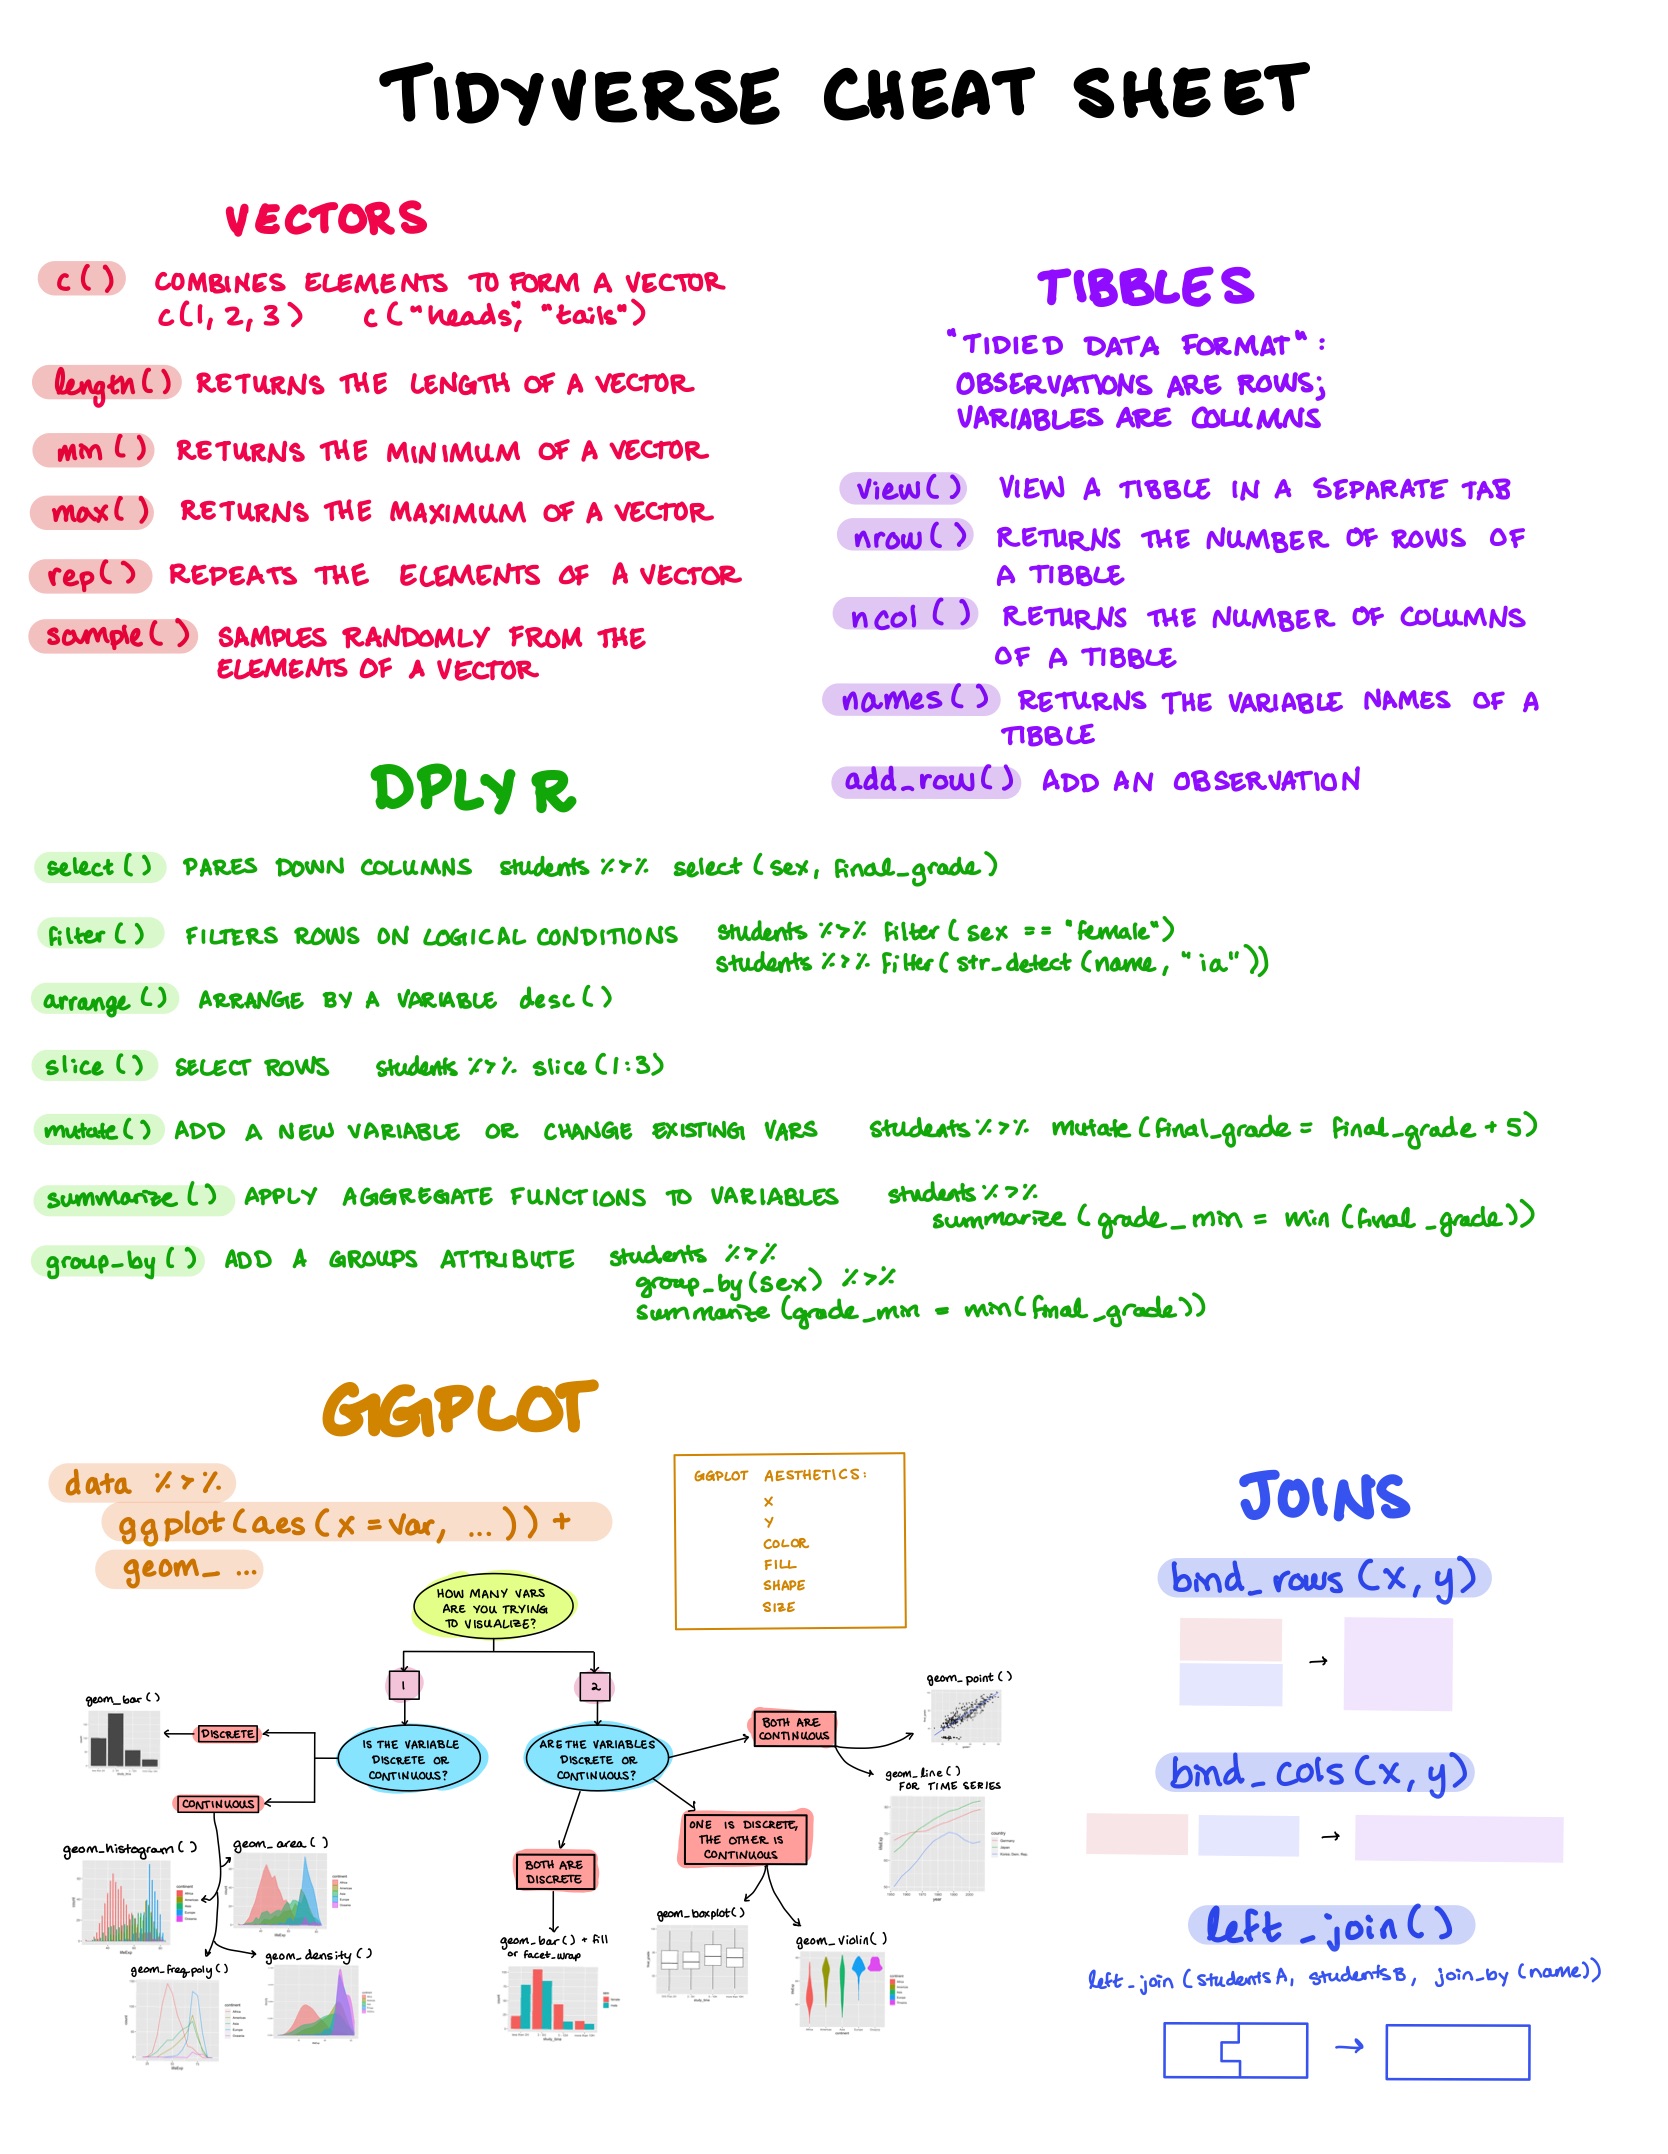
Use this cheat sheet as a reminder of the declarative programming tools we’ve learned:
Here’s your tool set for the classwork, along with how many times you should use them here:
- Functions to use on tibbles:
- nrow: the number of rows in a tibble. Use 2 times.
- ncol: the number of columns in a tibble. Use once.
- names: the variable names in a tibble. Use once.
- dplyr functions to use on tibbles:
- filter: pare down the rows of a tibble based on a logical condition. Use 0 times.
- select: pare down the columns of a tibble by name. Use once.
- slice: select rows of a tibble by integer position. Use 4 times.
- arrange: sort a tibble based on a variable: ascending by default; descending with the helper desc(). Use 4 times.
- mutate: create a new variable that is a transformation of one or more existing variables. Use 3 times.
- summarize: apply a summary function like min and median to a variable. Use 15 times.
- group_by: add a grouping attribute. Use 10 times.
- count: the same as group_by with summarize with n() to create groups and count group size. Use 3 times.
- functions to use on vectors in tibbles:
- max, min, median, mean, sum: use many times.
- n(): gives the current group size. Use 5 times.
- if_else: if_else(price > 1.5, “expensive”, “cheap”): takes a logical condition, what to do when TRUE, and what to do when FALSE. Use 0 times.
- case_when: similar to if_else, but takes multiple conditions. Use once.
case_when(
  price > 1.6 ~ "very expensive",
  price > .9 ~ "moderately expensive",
  price > .7 ~ "cheap",
  .default = "very cheap"
)Part 1
# a) How many observations are there in this data set?


# b) How many variables are in this data set?


# c) What are the variable names in this data set?


# d) Which transaction had the highest price? What were the wind speed and wave height that day?


# e) Which transaction had the largest quantity sold?


# f) What are the five lowest prices observed?


# g) What are the five highest wave heights observed?


# h) What is the minimum, maximum, and median price for whiting?


# i) What is the minimum, maximum, and median quantity sold for whiting?


# j) How many buyer races are represented in this data set?


# k) How many transactions were made by White buyers versus Asian buyers?


# l) What is the minimum, maximum, and median wind speed?


# m) What is the minimum, maximum, and median wave height?


# n) Create a variable for total revenue (price * quantity_sold). What is the average revenue per transaction?


# o) What is the total revenue by buyer race?


# p) Create a variable `day_of_week` in the original variable definition of `fish`. Then drop the variables mon, tues, wed, and thurs.
Part 2
# a) Do Asian buyers pay less for whiting? If so, by how much?


# b) Do Asian buyers buy higher quantities of whiting?


# c) Are Asian buyers more likely to buy whiting on certain days of the week?


# d) Is the price of whiting lower on certain days of the week?


# e) Are bigger transactions more likely to happen on certain days of the week?


# f) How does the price of whiting change depending on the wind speed? Also include the number of times we observed each wind speed.


# g) How does the price of whiting change depending on the wave height? Also include the number of times we observed each wave height.


# h) What is the average quantity sold when wave height is greater and less than 6? Include how many times we saw the wave height greater or less than 6.


# i) What is the average price on days when wind speed is greater than or less than 15? Include how many times we saw the wind speed greater or less than 15.


# j) Do Asian buyers pay less than White buyers for transactions larger or smaller than the median transaction size? Include how many times we saw Asian and White buyers making transactions larger or smaller than the median.
Download this Assignment
Here’s a link to download this assignment.